The short
version
Two things about global warming are not seriously contested. The planet has warmed by roughly 1.1–1.5°C since the late 1800s, and the cause is carbon dioxide from burning coal, oil and gas. That isn’t one study’s finding — it’s the same number, reached independently, since the physics was first worked out in the nineteenth century and re-confirmed every decade since.
What’s genuinely harder — and the reason this record exists — is connecting that warming to any particular fire, flood or heatwave. Sometimes the science can say precisely how much more likely or severe an event was made by a warmer world. Sometimes it can’t yet, and pretending otherwise would be its own kind of dishonesty. This record tracks both cases, and says plainly which is which.
Want to know where things stand right now? Jump to the 2026 section. Otherwise, keep scrolling — next is two centuries of how scientists got here.
Key climate indicators at a glance
What counts as
the record
This resource makes a narrow claim and tries to keep it. It assembles the research that institutions have formally recognised — and then asks what that research has to say about specific disasters since 2000.
Three kinds of work qualify for the canon. Intergovernmental and national-academy assessments — the IPCC cycles, the US National Research Council reports, the CSIRO–Bureau of Meteorology series, the Australian Academy of Science. Official monitoring products — the datasets and annual bulletins that governments and agencies maintain as the authoritative measurement of the climate system. And landmark peer-reviewed papers, included where they established something those assessments went on to rest upon.
Everything else was left out. Opinion, advocacy, journalism and commentary are absent, not because they do not matter but because a reference resource is only useful if its inclusion rule is legible.
Before there was
a warning
The physics was settled long before the politics began. By the time anyone convened a committee about carbon dioxide, the greenhouse effect had been described, measured, calculated, wrongly dismissed, and then recovered.
Joseph Fourier established in 1824 that the atmosphere keeps the Earth warmer than bare rock by preferentially blocking outgoing longwave radiation. Claude Pouillet measured the solar constant in 1838, anchoring the energy budget. The experimental breakthrough came in 1856, when Eunice Newton Foote showed that a cylinder of carbon dioxide heats more than one of air — and speculated that a higher-CO₂ past would have been a warmer one. Three years later John Tyndall, apparently unaware of her work, demonstrated the same thing far more rigorously, and inferred that changes in these trace gases could explain the ice ages.
In 1896 Svante Arrhenius put a number on it: halving or doubling atmospheric CO₂ would shift surface temperature by roughly four to five degrees. His colleague Arvid Högbom had already shown that industrial emissions were becoming comparable in magnitude to volcanic outgassing.
Then the field took a wrong turn that cost it fifty years. Knut Ångström argued in 1900 that CO₂'s absorption bands were already saturated by water vapour, so more of it could not matter. The objection ignored that CO₂ does its work in the dry upper atmosphere where the spectral lines do not overlap — but it dominated meteorology regardless. E.O. Hulburt refuted it quantitatively in 1931 and was ignored; Guy Callendar linked observed twentieth-century warming to fossil CO₂ in 1938 and was marginalised.
Post-war instrumentation broke the impasse. Gilbert Plass demolished the saturation argument with better spectroscopy in 1956. Revelle and Suess showed in 1957 that ocean chemistry would not absorb the excess fast enough, called it a “large scale geophysical experiment”, and demanded systematic monitoring. Charles Keeling delivered it from March 1958. And in 1967 Manabe and Wetherald produced the first physically rigorous model of the problem — work that won a Nobel Prize fifty-four years later.
A century of
agreement
The most quoted objection to climate science is that it keeps changing. The single most consequential number in the field tells the opposite story. Climate sensitivity — the warming expected from doubling atmospheric CO₂ — has been estimated by wholly independent methods for well over a century, and the answer has barely budged.
In July 1979 an ad hoc study group of the US National Research Council chaired by Jule Charney synthesised the available general-circulation modelling and reported that doubling CO₂ would warm the planet by 1.5 to 4.5°C, with 3°C most probable. That range survived four decades of scrutiny. The IPCC's Sixth Assessment, in 2021, gave a best estimate of 3°C with a likely range of 2.5 to 4.0°C — the same centre, narrower error bars.
If carbon dioxide continues to increase, the study group finds no reason to doubt that climate changes will result and no reason to believe that these changes will be negligible.Carbon Dioxide and Climate: A Scientific Assessment — NRC, 1979, p. vii
The record
itself
One hundred and sixty-four entries: every assessment, monitoring product, dataset and landmark paper in this record, from Fourier in 1824 to the bulletins of 2026. Search it, filter it, follow the citations. Every entry carries a working link to its primary source.
Kennaook /
Cape Grim
Australia holds one of the longest continuous atmospheric records on Earth, and has served as the world's most instructive laboratory for compound climate disaster. Both halves of that sentence belong in this record.
In March 1972 two CSIRO scientists, J.R. Garratt and G.I. Pearman, took an air sample at four kilometres over Bass Strait and measured 327 parts per million of carbon dioxide. Paul Fraser joined them in 1974, and the programme expanded to the non-CO₂ greenhouse gases. It led directly to the establishment, in 1976, of the Kennaook/Cape Grim Baseline Air Pollution Station on the north-west tip of Tasmania — one of only three international reference stations sampling genuinely clean baseline air, positioned where the wind arrives off the Southern Ocean having touched nothing.
Cape Grim's first CO₂ readings were around 330 ppm. By early 2022 the baseline stood near 413 ppm. Its air archive, running since 1978, is the longest complete collection of pristine air samples in existence — a physical library of the atmosphere that used to be.
Chronologically, Cape Grim belongs beside the Charney Report. Both are 1970s artefacts, and both were built on the assumption that somebody would later need the evidence.

What the national record shows
The CSIRO–Bureau of Meteorology State of the Climate series, biennial since 2010, is Australia's authoritative national assessment. These are its 2024 headline figures.
Over 24 million hectares were burnt. Tragically, 33 people died and extensive smoke coverage across much of eastern Australia may have caused many more deaths. … Consecutive and compounding natural disasters will place increasing stress on our systems.Royal Commission into National Natural Disaster Arrangements — Foreword, 28 October 2020
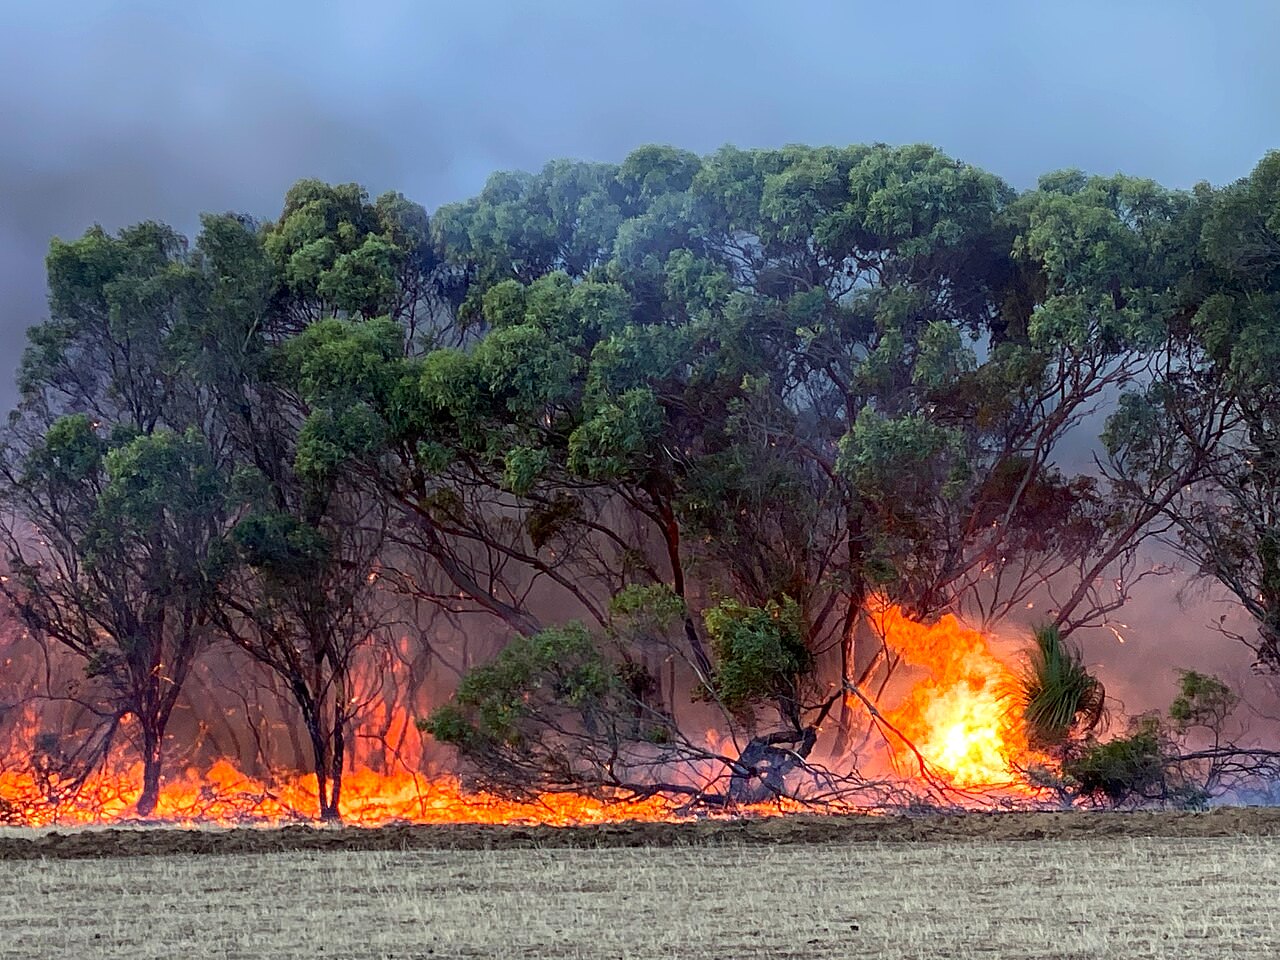
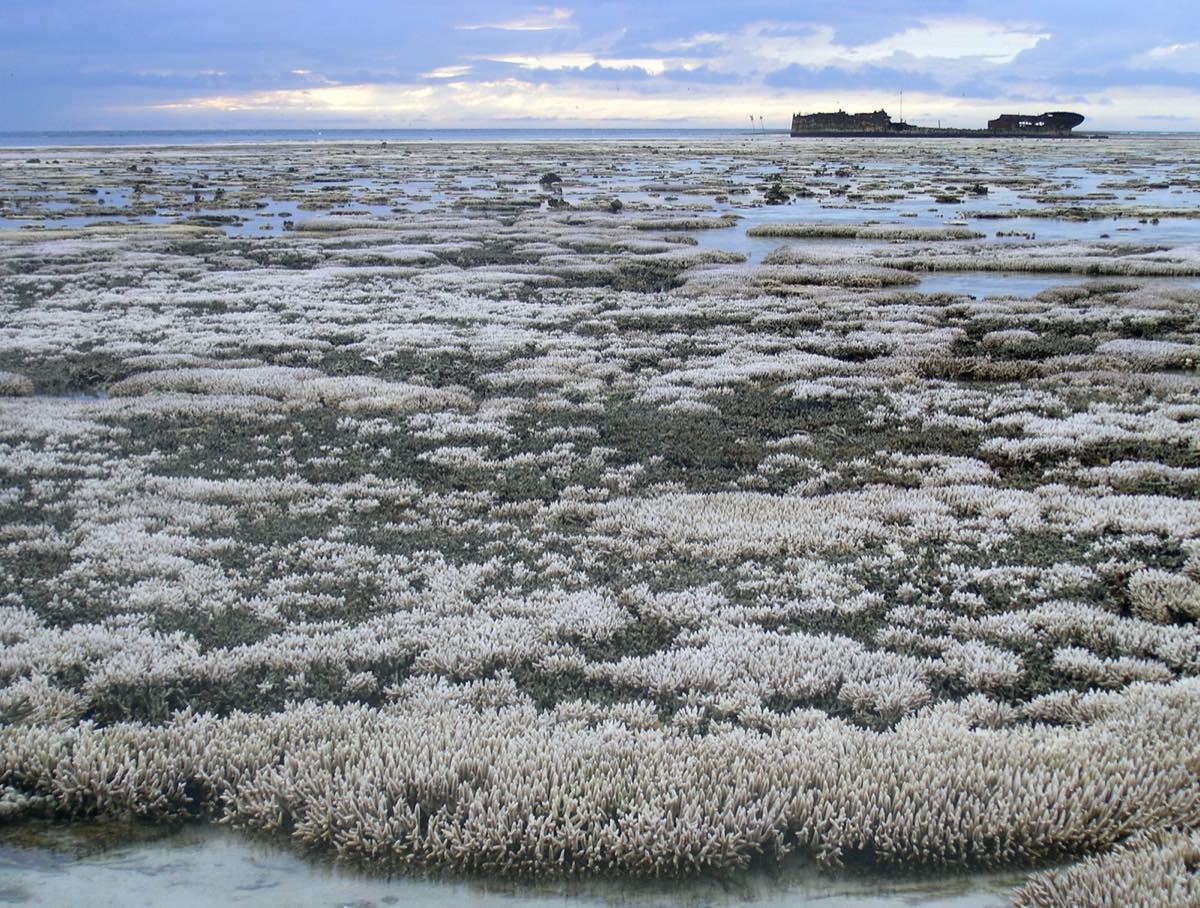
The Australian event record
Twelve dossiers, from the Millennium Drought to Cyclone Alfred, each carrying its attribution evidence or its explicit absence.
What the science
said, and what
then happened
Thirty-five global dossiers. Each one names the study that connects it to the research record above — or states plainly that no such study exists. Filter by hazard, or by how strong the attribution evidence actually is.
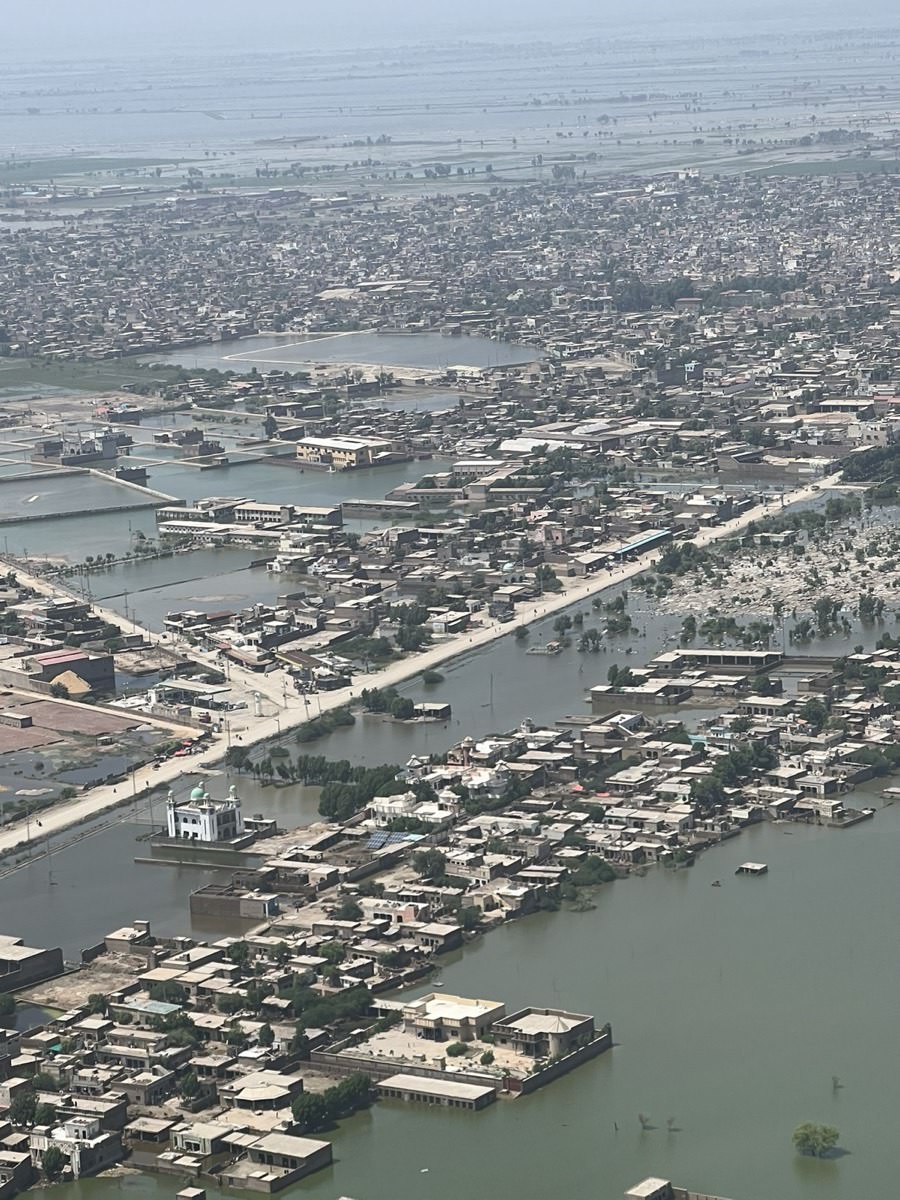
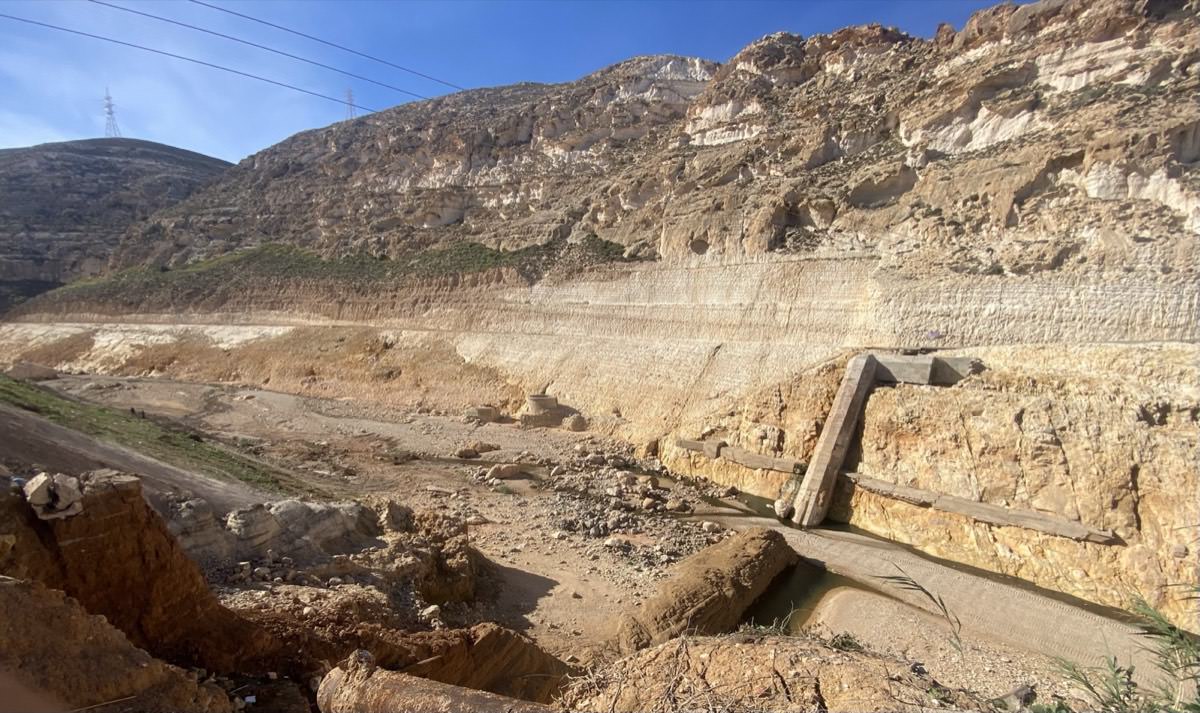
Where things
stand: H1 2026
Built from official bulletins retrieved in the first days of August 2026. 2026 is running third-warmest for its first half — and a strengthening El Niño means the heat now in the Pacific has mostly not reached the surface record yet.
Why 2026 is warm but not the record
The first five months of 2026 ran under ENSO-neutral to weak La Niña conditions, which suppressed anomalies relative to the 2024 record. NOAA declared El Niño on 11 June 2026; by 9 July the Niño-3.4 index stood at +1.2°C, with the Climate Prediction Center assigning a 97% chance the event persists into early 2027 and an 81% probability it becomes a very strong event in October–December.
An El Niño's effect on global surface temperature lags the Pacific by three to six months. On that mechanics, the WMO's decadal update names 2027 as the likely next record year, and puts a 91% probability on at least one year in 2026–2030 temporarily exceeding 1.5°C.
What the ocean did
June 2026 set a new record for global sea surface temperature in any June, at 20.92°C, edging past 2024's 20.90°C. Berkeley Earth put first-half ocean surfaces 1.12°C above pre-industrial and land 1.96°C. The WMO's State of the Global Climate 2025, published on 17 March 2026, reported Earth's energy imbalance at its highest level in the 65-year record.
The ice
The Arctic maximum on 15 March 2026 reached 14.29 million km² — tied for the lowest winter maximum in the 48-year satellite record, 1.36 million km² below the 1981–2010 average. The Antarctic minimum on 26 February came in at 2.58 million km²: 16th lowest, and a notable rebound from the record lows of 2022–2025, attributed to strong southward winds pushing ice outward in the Weddell Sea.
The reefs
The fourth global bleaching event was confirmed ended by mid-2025, having heat-stressed 84% of the world's reef area across 83 countries. With El Niño developing, NOAA's outlook issued 21 July 2026 flagged high bleaching risk from August to November across the North Pacific, Florida and the Caribbean. The Florida Keys were at Alert Level 1 by early July, tracking at or above 2023's pace. A fifth global event is anticipated but not declared.
Governance
COP31 will be held in Antalya, Türkiye from 9–20 November 2026, under a split arrangement settled at COP30: Türkiye holds the presidency and hosts, while Australia holds exclusive authority over the negotiations as President of Negotiations, with a Pre-COP summit in a Pacific island country.
The events of the first half
Nine dossiers from January to early August 2026, including the summer just finished in Australia. Note that the deadliest — the South-East Asian and South Asian floods — are precisely the ones without attribution studies.
What this section could not establish
- Official July 2026 global temperature. Neither the Copernicus ERA5 bulletin nor the NOAA NCEI report had been published by 4 August 2026. The figure shown is a preliminary independent ERA5 estimate and is labelled as such.
- Mauna Loa monthly CO₂ for January–March and June 2026. Only April (~431 ppm) and May (432.0–432.3 ppm) were confirmed from cited sources.
- IPCC AR7 cycle progress during H1 2026. Nothing retrievable. The AR7 cycle began in July 2023, all planned scientific content was agreed at the 63rd Plenary in Lima in October 2025, and Working Group reports are expected roughly 2027–2029 — but no 2026 progress could be verified.
- Rapid attribution for the June 2026 European heatwave specifically. A WWA trend study on European heatwaves exists, as does a UK-specific mortality attribution; a dedicated rapid study for this event was not retrievable.
- Systematic disaster totals. EM-DAT and ReliefWeb were not crawled; H1 2026 impact figures derive from news reporting against named official sources rather than database aggregation.
- Regional coverage gaps. No verified distinct West African, East African or South American events for H1 2026 beyond the Chile–Argentina fire weather study. Absence of a retrieved record is not evidence that nothing occurred.
How you can
say that
Attribution science is the hinge that connects the canon to the disasters. It is also the part most often misreported — in both directions.
Probabilistic event attribution asks a precisely bounded counterfactual question: how has human-caused climate change altered the likelihood or magnitude of an event of this type? It does not claim any storm or heatwave was “caused by” climate change. Natural variability is always in play. The claim is about shifted odds.
The analogy the field has used since Myles Allen framed it in 2003 is tobacco. Smoking does not cause any particular tumour, but it raises the probability substantially — and that shift is both real and legally meaningful.
Mechanically, two large ensembles of model simulations are run: a factual world with observed greenhouse gas concentrations, and a counterfactual world without anthropogenic emissions. The event is defined objectively in advance — the probability of July mean temperature in Moscow exceeding a threshold, say, or of seasonal rainfall over England and Wales reaching flood-inducing levels. Comparing ensembles yields a probability ratio: this type of event is now X times more likely. Or an intensity shift: the event was Y degrees hotter than it would have been.
Both framings come from the same ensemble, and both are legitimate. The intensity version tends to communicate better; the probability ratio is more tractable for risk pricing and litigation.
The 2010 Russian heatwave taught the field how much the framing matters. One study called the event mainly natural; another found an 80% probability its record would not have occurred without warming. Otto and colleagues showed there was no contradiction — the event was largely internally generated in magnitude yet largely externally driven in probability. Both papers were right about different questions.
Where the method is strong, and where it is not
Heat. The thermodynamic signal is large relative to model uncertainty, observational records are long, and independent modelling groups converge. Nearly every major heat event since 2003 has a quantified study. Also robust: fire weather in Australia 2019–20 and Canada 2023, both with peer-reviewed probability ratios.
Heavy precipitation. The thermodynamics are sound — a warmer atmosphere holds more moisture per Clausius-Clapeyron — but the dynamical component, whether a storm's track or structure changes, is harder to resolve. Typical findings: 20–75% intensity increases, or 1.2–9× likelihood. Also moderate: drought, where meteorological and agricultural drought can attribute differently, as the Horn of Africa study showed.
Tornadoes, hail and convective storms. The relevant scales sit below climate model resolution, records are short and inhomogeneous, and mechanisms are incompletely understood. Practitioners should not issue probabilistic attribution for these. Also weak: individual tropical cyclone track and intensity — rainfall is the exception — and single-year sea ice extremes, where the 2023 Antarctic collapse exceeded all model expectations and remains only partly explained.
How the science
was tested
A reference resource is stronger for documenting the challenges the science withstood. Each of these episodes was resolved in public, by evidence, and each is cited here to its primary source.
The Global Climate Coalition, 1989–2002
Formed by fossil-fuel and allied industries to oppose climate regulation. A 1995 internal primer drafted by its own Science and Technology Assessment Committee — written by a Mobil staff scientist and released later in litigation — explicitly accepted anthropogenic climate change and rebutted contrarian arguments one by one. That section was cut before publication. The distributed version stated instead that claims of significant human impact on climate “seem unsubstantiated.”
ExxonMobil's two sets of books
Supran and Oreskes analysed 187 ExxonMobil communications from 1977–2014: 83% of its peer-reviewed papers acknowledged human-caused climate change; 12% of its newspaper advertorials did. A 2023 follow-up in Science assessed the company's own projections and found 63–83% were accurate, correctly forecasting roughly 0.20°C per decade — comparable to academic models of the era. ExxonMobil disputes the framing of both analyses.
The hockey stick
McIntyre and McKitrick argued in 2003 and 2005 that the principal-components method in Mann, Bradley and Hughes had produced a spurious shape. The 2006 National Research Council review found the core conclusion broadly correct and robust to alternative methods, while noting that pre-1400 uncertainties had been conveyed too confidently. Wahl and Ammann demonstrated in 2007 that the critique did not substantively alter the reconstruction. Multiple independent reconstructions using different proxies have since agreed.
“Climategate”, 2009
Roughly a thousand emails were taken from the University of East Anglia's Climatic Research Unit weeks before Copenhagen. Four separate inquiries followed. The Oxburgh panel found no evidence of scientific malpractice. The Muir Russell review concluded that the scientists' “rigour and honesty are not in doubt,” while criticising a pattern of failing to display proper openness on information requests. The House of Commons Science and Technology Committee found no corruption of conclusions. A Penn State inquiry cleared Michael Mann. No inquiry found data fabrication.
The “hiatus”
AR5 noted an apparent slowdown in surface warming after 1998, which was widely amplified into a claim that warming had stopped. Karl et al. corrected biases in sea-surface and land records and found early-21st-century warming at least as fast as the late twentieth. Medhaug et al. showed the residual was explained by definition choices, dataset differences and natural variability. Every year from 2015 to 2025 then ranked among the eleven warmest on record.
What to check
before you cite
This record was assembled against primary sources. Some figures resisted verification, and honest use of this resource means knowing which.
Known caveats in this record
- Black Summer area burned. The Royal Commission's official figure is “over 24 million hectares.” Satellite and state-agency estimates range from roughly 18 to 33 Mha depending on which fire types, states and dates are counted. Any single number here is methodology-dependent.
- Black Summer smoke deaths. The peer-reviewed estimate is 417 (95% CI 153–680); a later estimate by the same group gives ~445. Both cover only four eastern states, so both understate the national toll.
- Derna, 2023. Death tolls run from 4,333 (Libyan Red Crescent) to over 11,300 (UN OCHA reporting), with higher figures cited by some officials. No systematic count exists. The WWA report URL for this event no longer resolves; the “up to 50×” rainfall figure is cited via secondary sources referencing that report and should be checked against the peer-reviewed version.
- 2010 Russian heatwave. The ~55,000 figure is a modelled excess-mortality estimate, not a registry count; credible ranges run 25,000–56,000.
- Hurricane Maria. 2,975 is the official recognised toll; Kishore et al. estimated 4,645. Both are methodologically defensible.
- First Mauna Loa annual mean above 400 ppm. The first daily reading (9 May 2013) and the 2013 global annual mean (395.3 ppm) are confirmed; the exact year the annual mean crossed 400 ppm could not be verified to a primary NOAA source.
- Pre-1990 IPCC figures. Some FAR, SAR and TAR headline numbers and sub-report URLs were assigned from the established archival record rather than extracted from the original Summary for Policymakers text. Verify against archive.ipcc.ch for formal citation.
- Two omitted papers. A 2025 Nature paper on attributing economic damages to individual emitters, and Newman & Noy on global attributable extreme-weather costs, could not be verified and were left out rather than cited speculatively.
- Högbom (1895–96) and Ångström (1900). No accessible digitised originals were found; both rest on the American Institute of Physics history of climate physics as an authoritative secondary source.
- Australian Academy of Science. The Science of Climate Change: Questions and Answers exists in 2010 and 2015 editions. The 2021 update was published under a different title, The Risks to Australia of a 3°C Warmer World — there is no 2021 edition of the Q&A.
- National Climate Risk Assessment. The status and findings of Australia's 2024–25 NCRA could not be verified and it is therefore not entered in the canon.
Principal sources
World Meteorological Organization
US National Academies Press & National Research Council
NOAA National Centers for Environmental Information
NASA GISS Surface Temperature Analysis
Copernicus Climate Change Service
Met Office Hadley Centre — HadCRUT5
Berkeley Earth
NOAA Global Monitoring Laboratory — Mauna Loa
World Weather Attribution
CSIRO & Bureau of Meteorology — State of the Climate
Australian Bureau of Meteorology
Australian Institute of Marine Science
Australian Academy of Science
National Snow and Ice Data Center
NOAA Coral Reef Watch
Global Carbon Project
UNEP Emissions Gap Report
US Global Change Research Program — NCA5
American Institute of Physics — History of Climate Physics
EM-DAT, CRED / UCLouvain
UNFCCC
How to cite this record
Global Code Red: The Climate Research Record, 1824–2026. codered.global, compiled 4 August 2026. Accessed [date].
Where you are citing a specific finding, cite the primary source linked from that entry rather than this page. This record is an index to the literature, not a substitute for it.